
Native Plant Material Survey
Executive Report
In 2023, Laukahi: The Native Plant Network hosted a Native Plant Material Survey for Hawaiʻi. Here, we report on the results of the survey and discuss lessons learned from this collective call, bringing attention to Hawaiʻi's "Need for Seed".
Background
For those of us in natural resources management and biocultural restoration, our work regularly feels the constrains of limited native plant materials to scale up restoration goals. However, it wasn't until the Maui wildfires of 2023 that this need was acutely felt beyond the world of endangered species management and watershed protection.
How did we get here? Hawaiʻi has faced centuries of ecological degradation. Key factors include the introduction of industrial activity, the subsequent abandonment of industrial agricultural enterprises, and the integration of Hawaiʻi into global trade routes thus increasing intentional and accidental plant and animal introductions. These landcover histories, as well as the loss of mutualist interactions, predation by introduced animals and other competitive pressures from non-native species, has led to an extremely endangered ecological assemblage–situated within a fire-prone landscape. Today, 90% of nationally listed endangered species are endemic to Hawaiʻi (citation). Additionally, close to 30% of vegetated landcover is considered novel savanna/grassland (citations), often comprised of species that not only thrive in, but perpetuate fire-prone conditions (citations).
Around the world, restoration considered a key strategy for endangered species management and resilience to disturbance regimes. In Hawaiʻi, the restoration of biocultural resources has been integral to the revitalization of Hawaiian lifeways. Here, we explore the current status of the Native Plant Material supply chain, as defined through the collective experiences of the NPM survey respondents. Additionally, we draw on the survey to visualize potential mechanisms to expand our NPM supply chain into one that can meet all of our restoration needs.
Methods
This survey was hosted by Laukahi: The Native Plant Network. It was shared with numerous partner list serves, including Laukahi, the Hawaiʻi Seed Bank Partnership, Hawaiʻi Wildfire Management Organization, Pacific Fire Exchange, Ecosystems Extension, Pacific Region Invasive Species and Climate Change network, and Forest Stewardship program participants. It was further shared with additional stakeholders such as the Landscape Industry Council of Hawaiʻi, Kaulunani–the state division of Urban Forestry, and...
Communications encouraged email recipients to share the survey broadly to expand the reach of the survey invitations, resulting in a snowball sampling scheme.
Survey Structure
The survey included multiple choice (both best answer and choose all that apply) and open-ended questions. Responses are reported as percent of total response, given the total number of responses for any given section. For "choose all that apply" questions, each response is reported as number of responses out of total number of responses. Single response multiple choice questions should sum to 100%.
Open-ended questions were explored through a thematic analysis. Any quotes shared are done so anonymously.
Questions and Results
Questions posed in the survey are provided below. Click on each question to reveal a graph and description of the responses. Questions 1-4 have been redacted to protect the privacy of survey participants and reporting commences with Question 5.
General Questions
What type of organization is it?
[The organization that you work for]

Twenty-four percent of respondents work for a government agency (n=37, any of Federal, State, or County government), and 22.6% for a non-government organization (n=35). Fifteen percent work for organizations that fall into a partnership/agreement between various types of organizations (n=23). Twelve percent of respondents were individuals (n=18), 11.0% were from commercial entities (n=17), and 8.39% were either a research-based organization or an educational institution (n=13). Only, 1.29% represented community groups (n=2) and 6.45% defined themselves as “other”, (n=10).
What is the role of your organization?

Respondents represented organizations with role(s) of land stewardship (n=106, 72.1%), endangered species conservation (n=72, 49.9%), nursery operations (n=69, 46.9%), landowners (n=49, 33.3%), seed bank/seed storage (n=48, 32.7%), and botanical gardens (n=15, 10.2%). Respondents chose all roles that fit their organizations, as such, total counts for each role are represented as a percentage of total responses.
Where do you work?

Sixty-six respondents reported working on Hawaiʻi Island, 37 on Maui, four on Kahoʻolawe, 12 on Lānaʻi, 15 on Molokaʻi (15), 64 on Oʻahu, 33 on Kauaʻi (33) and five in the Northwestern Hawaiian Islands (Papahānaumokuākea Marine National Monument, PMNM). Sixteen percent of respondents selected multiple islands (n=25) with only one respondent (0.026%) solely working on Kahoʻolawe, no respondents only working on Lānaʻi and four (0.096 solely working on Molokaʻi.
How many staff are employed by your organization?

Respondents worked for organizations with more than 50 staff (n=35, 23.2%), 21-50 staff (n=13, 8.61%), 11-20 staff (n=19, 12.6%), 5-10 staff (n=30, 19.9%), less than 5 staff (n=32, 21.2%), were the sole operator of their organization, with part-time capacity (n=14, 9.27%), or the sole, full-time operator of their organization (n=8, 5.30%). Note that there were instances of multiple respondents per organization. These results are not normalized by number of organizations represented in responses.
What is the role of your organization in the NPM supply chain in Hawaiʻi?

Respondents were asked more specifically, what role(s) their organization plays in the native plant material (NPM) supply chain–indicating all relevant roles. The roles were described as “NPM User” (n=129, 82.9%), “NPM Collector” (n=84, 53.8%), “NPM Producer: Plants” (n=71, 45.5%), “NPM Producer: Seeds” (n=52, 33.3%), “Other” (n=42, 26.9%).
Which kinds of habitats do you work in?

Forty-three percent (n=67) of respondents reported working in coastal and strand, 66.0% (n=103) in dry forest, 62.8% (n=98) in mesic forest, 53.2% (n=83) in wet forest, 25.0% (n=39) in wetlands, 23.7% (n=37) in bogs, 16.0% (n=24) in subalpine, and 15.4% (n=24) in other undefined ecosystems (e.g., agriculture, urban forestry). Respondents were able to choose all ecosystems that apply and as such, counts do not add up to the total number of survey responses and percentage reported represents the number of counts for a given option, out of the total number of responses for the question.
How important would these project planning resources be to your organization?

Eighty-one percent thought species lists to guide restoration of specific plant communities would be valuable and 6% thought they would not be, with 13% neutral to their value. 84% thought examples of restoration site landscape designs would be valuable and 7% did not, with 9% neutral. 80% thought that lists of workhorse species for each region would be valuable and 5% disagreed, with 14% neutral. 72% felt an online marketplace for Native Plant Materials would be valuable and 8% disagreed, with 20% neutral to its value. 78% thought guidelines for using Laukahi’s “Seed Zones in Hawaiʻi” would be valuable with 5% not seeing value in it and 17% with neutral inclinations about its value.
How valuable would these project implementation resources be to your organization?

There was overall agreement in the value of implementation resources. 82% saw value in direct seeding protocols, 8% saw no value and 10% were neutral. 82% saw value in NPM propagation protocols, 8% saw no value and 10% were neutral. 79% felt monitoring protocols for restoration sites were valuable, 11% saw no value and 10% were neutral. 79% saw value in outplanting protocols, 7% saw no value and 14% were neutral. 81% saw value in seed collection protocols, 6% saw no value and 13% were neutral. 78% saw value in seed testing standards, 8% disagreed and 14% were neutral. 76% thought protocols for seed processing equipment were valuable, 8% did not and 16% were neutral.
Do you agree/disagree with the following statements about the NPM supply chain?


When asked if demand for NPM is low, 60% of respondents disagreed while 15% agreed and 25% felt neutral to the statement. Thirty-eight percent agreed that demand is inconsistent or unreliable, 31% disagreed, and 31% were neutral. Respondents were largely neutral (50%) to the statement of NPM orders being made at too short notice, however 44% agreed. Only 6% disagreed.
Thirty-six percent of respondents agreed that NPM are generally unavailable, 29% disagreed and 35% were neutral to the statement. When considering the quality of available NPM, 51% of respondents agreed that while NPM were available, but only from a few species or they were in poor condition. Twenty-one percent disagreed with this statement and 28% were neutral. In terms of the definition of locally adapted material being too restrictive, 52% of respondents were neutral while 27% agreed that and 21% disagreed


Respondents overwhelmingly felt that the market is unwilling to pay for the true cost of collection and production (66%). Only 6% disagreed and 29% were neutral. Similarly, 54% agreed with the statement that it is difficult to secure funding for NPM production or procurement and only 5% disagreed. However, 41.2% were neutral.
Respondents largely agreed that there is a lack of trained collectors (59%), with only 12% disagreeing–although 30% were neutral to the statement. Most respondents were neutral to the statement that obtaining NPM collection permits is too difficult (51%), with 33% in agreement and 16% disagreeing. Respondents mostly agreed that obtaining access to wild populations is too difficult (48%), 35% were neutral to the statement, and 17% disagreed. Sixty-seven percent of respondents agreed that future demand for large quantities of NPM would be difficult to meet from wild harvest due to the declining health of wild plants, 25% were neutral and only 8% disagreed. Additionally, 60% agreed that NPM should come from seed production areas to meet these shortfalls from wild populations, 12% disagreed and 28% were neutral.
What do you think is the biggest barrier(s) to increasing the availability of NPM?
Using NPM
For which of the following purposes does your organization use NPM?
Do you use direct seed-sowing for restoration?


Respondents used NPM to conduct Wildlife and plant habitat restoration (n=117, 86.7%), Watershed rehabilitation (n=86, 63.7%), Traditional/cultural uses (n=57, 42.2%), Horticulture/Landscaping (n=56, 41.5%), Post-fire revegetation (n=54, 40.0%), Green breaks for fire prevention (n=46, 34.1%), carbon capture (n= 41, 30.4%), Wood products (n=24, 17.8%), or other purposes (n=20, 14.8%). This included education, windbreaks for agricultural operations, and food production.

Respondents indicated whether they always use direct seed sows, that is to say, the method is used in all restoration sites (4.55%), commonly sow seeds directly—at least once at every restoration site (16.7%), sometimes directly sow seeds, although these actions are not usually planned (22.0%), rarely use direct seed sowing—only opportunistically (34.1%), or never used direct seed sows (22.7%). One respondent described, “while we use seed scatter occasionally, it is always planned into the restoration processes”; another said, “we sometimes use direct seeding, but it is both planned and unplanned [opportunistic].”
Are you satisfied with the availability of NPM for your projects?
How satisfied are you with the availability of locally-adapted NPM?

The NPM User group was evenly distributed in terms of their satisfaction with the availability of NPM for their projects. In terms of locally adapted NPM, 33% were satisfied, 34% dissatisfied and 33% neutral. When asked to consider NPM availability, in general, these patterns were mirrored with 26% satisfied, 38% dissatisfied and 34% neutral
How concerned is your organization about where NPM are sourced from?

The NPM user group (n=129) was overwhelmingly concerned (83%) with the source of the NPM their organization uses, with only 6% unconcerned and 10% neutral.
What factors limit your organization's use of locally-adapted NPM?

How does your organization define where locally-adapted NPM are sourced from?

Respondents were provided sample definitions of “locally adapted” source material, sourced within each project site (n=36, 27.7%), using Laukahi’s provisional Seed Zones (n=28, 21.5%), from anywhere on their island (n=19, 14.6%) or anywhere in Hawaiʻi (n=75.38%). 10.8% (n=14) reported that their organization had no definition or rules defining “locally adapted” source material, and 20% (n=26) responded that their organization use definitions other than the choices offered.
My organization would be open to changing project specifications to require the use of locally-adapted NPM.

Sixty-four percent (n=58) of respondents reported that their organization would be open to changing their project specifications to require the use of locally adapted NPM. Only 4.40% (n=4) disagreed and 31.9% (n=29) did not know how their organizations would feel about changing project specifications to require the use of locally adapted NPM.
How does your organization select which species of NPM to use?

Respondents use multiple methods to select species to use–specifically reference site information (n=104, 77%), reference materials, e.g., flora and field guides (n=75, 55.6%), cultural relevance (n=51, 37.8%), commercial availability (n=34, 25.2%), outside consultants (n=23, 17.0%), or other means (n=37, 27.4%). A few respondents did not know how their organization selected species for their work (n=9, 6.67%).
What are the 10 most commonly used native plants?

The top nine genera used by respondents (n=113) were Acacia (79.0%), Dodonea (71.7%), Metrosideros (57.5%), Pipturus (32.7%), Scaevola (31.0%), Sida (30.1%), Carex (27.4%), Santalum (25.7%), and Erythrina (24.8%).
How would you use more seeds?

Users of native plant material reported that they would use more seed to conduct more outplantings (n=109, 80.7%), increase the biodiversity at their sites (n=104, 77.0%), conduct direct sowing (n=74, 54.8%), establish Seed Production Areas (n=56, 41.5%), or other uses (n=15, 11.1%).
Which 10 native plants would you use if access to them weren't limited?

The top eleven genera that respondents would like to use but have difficulty accessing (n=88) were, Santalum (40.9%), Metrosideros (30.6%), Acacia (25.0%), Diospryros (19.3%) and Psydrax (19.3%), Polyscias (19.3%), Myrsine (18.2%),Pittosporum (18.2%), Touchardia (15.9%), Alyxia (14.7%), Erythrina (14.7%), and Cyanea (14.7%).
How far in advance does your organization forecast their NPM needs?

Planning for the use of NPM is largely happening at annual timeframes (n=37, 29.1%) or 1–2-year cycles (n=38, 29.9%). And while several respondents reported planning for 3–5-year time frames (n=11, 8.66%), less than 1% reported planning 5–10-year intervals (n=1, 0.79%) and less than 3% at greater than 10-year time frames (n=3, 8.66%). However, 27 respondents (21.3%) reported their organization do no advanced planning and 10 (7.87%) were unsure about their organization's planning timeframe.
How do you expect your organization's demand for NPM to change over the next 10 years?

Overwhelmingly, respondents expect their organization’s demand for native plant material to increase over the next ten years (n=104, 80.6%), decrease (n=5, 3.88%), or stay the same (n=16, 12.4%). There was also some uncertainty in how organizational demand will change (n=5, 3.88%).
Collecting NPM
What are the sources for your seed?

Seeds are sourced from wild populations (n=98, 90.0%), from within restoration sites (n=77, 70.6%), seed production areas (n=36, 33.0%), or “other” undefined sources (n=14, 12.8%). Two respondents were unsure where their organization sources seeds from (1.83%).
Where are the collections being used?

Seeds are collected to be used on own organization’s land (n=87, 79.8%), to be used by conservation partners (n=59, 54.1%) for commercial production (15, n=13.8%), and for undefined “other” contexts (n=17, 15.6%).
Where does your organization collect seed from wild populations?

Wild collections are made on public lands not owned by respondents’ organization (n=57, 35.8%), private lands not owned by respondents’ organization (n=54, 34.0%), or land owned by the organization (n=18, 11.3%) or are from “other” sources undefined by survey (n=11, 6.91%). Sometimes other organizations collect seeds for the respondents’ organization (n=18, 11.3%). Only one respondent reported not knowing where wild seeds are sourced from (0.65%).
What is the geographic range over which you collect seed?

The most common geographic range across which respondents collect seed were “On Island" (n=35, 32.7%), on organization’s land (n=28, 26.25%), within Laukahi’s Seed Zones (n=17, 15.9%), from the site where they will be planted (15, 14.0%), anywhere in Hawaiʻi (n=8, 7.48%), or from plants directly adjacent to the planting site (n=4, 3.74%).
How many years do you typically store seeds before they are used?

Respondents use seeds immediately after collection, i.e., no storage (n=20, 18.9%), store seeds for less than one year (n=34, 32.1%), store seeds for 1-3 years (n=34, 32.1%), 3-5 years (n=12, 11.3%), 5-10 years (n=4, 3.77%) or more than 10 years (n=2, 1.89%) before use.
What ten species do you collect the most frequently?

The top eight genera collected by respondents (n=86) were Dodonaea (68.6%), Acacia (68.6%), Metrosideros (57.0%), Erythrina (26.7%), Coprosma (25.6%), Sida (24.4%), Santalum (23.3%), and Scaevola (23.3%).
How many days per year are spent collection from wild populations?

Respondents reported collecting seeds from wild populations over more than ten days (n=54, 52.4%), for 5-10 days (18, 17.5%), for 3-5 days (n=13, 12.6%), for 1-3 (n=9, 8.74%), or zero days (n=9, 8.74%) per year.
Do you provide seed testing information for your seed?

22.9% of collectors (n= 24) provide seed testing information for their seeds; 77.1% (n=81) of collectors, producers do not conduct seed testing.
What ten species would you like to collect but cannot obtain access?

The top genera that collectors would like to collect but are challenged by access were Santalum (25.5%) Acacia (19.6%), Cyanea (19.6%), Polyscias (19.6%), Diospyros (17.6%), Pritchardia (17.6%), Notolaea (15.7%), Alyxia (11.8%), Psydrax (11.8%), Sapindus (11.8%), and Touchardia (11.8%).
What percentage of collections are initiated for specific demand (i.e., I know there is a market or near-term use for this species)?
What percentage of your collections are done to meet a potential request (i.e., I hope there might be a need for this species?

Respondents largely reported that more than 61% of collections account for a specific demand (that is, knowing there is a market or near-term use for this species) (n=, 64.9%). 21-60% of collections account for a specific need by less than 15% of respondents (n=, 12.4%) and less than 20% of collections attributing to a specific need for only 23.7% of respondents (n=). Less than 20% of collections are made for a potential request (that is, I hope there might be a need for this species) for 64.9% of respondents (n=), and 21-60% of collections are made to meet a potential demand for 10.3% of respondents. Less than a quarter of respondents (n=, 24.7%) reported that more than 61% of their collections are made to meet a potential need.
Producing NPM
Do you produce seed for direct sowing?

Fifty-two percent (n=37) reported that they produce seeds for direct seeding, and 47.9% (n=34) indicated that they do not produce seeds for direct seeding.
Do you provide seed testing information for your seed?

Twenty-two percent of producers (n=15) provide seed testing information for their seeds and 78.3% (n=15) of producers do not conduct seed testing.
Do you produce and supply plants for restoration projects?

Eighty-nine percent (n=63) reported producing plants for restoration projects and 11.3% (n=8) indicated that they do not produce plants for restoration projects
What facilities does your organization have to produce NPM?
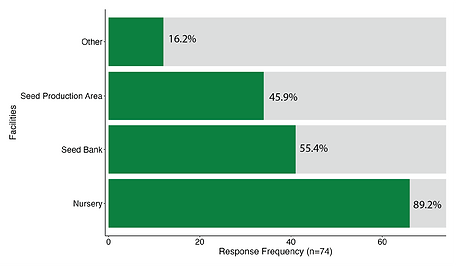
Current facilities include nurseries (n=66, 89.2%), seed banks (n=41, 55.4%)–although this is undifferentiated between long-term seed storage or general seed storage–Seed Production Area (n=34, 45.9%), however, it is unclear whether this refers to a general area where seeds are collected or an area dedicated to seed production, or other undefined facilities (n=12, 16.2%).
What container size are the majority of your plants grown to?

Most containerized plants are produced in either dibble tubes (n=22, 31.4%) or in 4-inch pots (n=21, 30%), although some organizations grow most of their plants in half-gallon (n=10, 14.3%) or 1-gallon pots (n=9, 12.9%). Growing plants out in pots greater than 1 gallon (n=5, 7.14%) or 2-inch pots (n=3, 4.29%) is uncommon. 52.1% reported that they produce seeds for direct seeding, and 47.9% indicated that they do not produce seeds for direct seeding.
How many native species from each of the following plant groups do you grow?

The table presents the number of nurseries producing various quantities of species across five plant habits: Ferns, Grasses and Sedges, Herbs, Shrubs, and Trees. For each plant habit, nurseries reported the number of species produced in one of five categories: 0 species, 1 species, <10 species, 10–20 species, and >50 species. The values reflect the count of nurseries (n) and the corresponding percentage of the total (percent). For ferns, 22 nurseries (29.73%) reported producing 0 species, 5 nurseries (6.76%) reported producing 1 species, and 41 nurseries (55.41%) reported producing fewer than 10 species. An additional 3 nurseries (4.05%) reported producing between 10 and 20 species, and 3 nurseries (4.05%) reported producing more than 50 species. For grasses and sedges, 20 nurseries (27.03%) reported producing 0 species, 2 nurseries (2.70%) reported producing 1 species, and 39 nurseries (52.70%) reported producing fewer than 10 species. Another 10 nurseries (13.51%) reported producing between 10 and 20 species, while 3 nurseries (4.05%) reported producing more than 50 species. For herbs, 19 nurseries (25.68%) reported producing 0 species, 2 nurseries (2.70%) reported producing 1 species, and 39 nurseries (52.70%) reported producing fewer than 10 species. Additionally, 9 nurseries (12.16%) reported producing between 10 and 20 species, and 5 nurseries (6.76%) reported producing more than 50 species. For shrubs, 7 nurseries (9.46%) reported producing 0 species, and no nurseries reported producing exactly 1 species. A total of 31 nurseries (41.89%) reported producing fewer than 10 species, while 26 nurseries (35.14%) reported producing between 10 and 20 species. Finally, 10 nurseries (13.51%) reported producing more than 50 species. For trees, 6 nurseries (8.11%) reported producing 0 species, 1 nursery (1.35%) reported producing 1 species, and 30 nurseries (40.54%) reported producing fewer than 10 species. Another 30 nurseries (40.54%) reported producing between 10 and 20 species, and 7 nurseries (9.46%) reported producing more than 50 species.
If your organization produces both native and non-native plant materials, what percent are native?

For 35.5% percent (n=24) of respondents, native plants account for 0% of their inventory. However, 45.6% (n=31) of respondents reported that native plants accounted for more than 80% of their inventory Only 2.92% (n=2) reported that less than 5% of their inventory is native, and 5.88% (n=4) have inventories that are 5-25% native. Only 2.94% (n=2) have 25-50% of their production going towards native plants, and 7.35% (n=5) reported that 50-80% of their production is focused on native plants.
What percent of NPM are grown to meet opportunistic demand (i.e., I hope there might be a demand for this species)?

Twenty-eight percent (n=19) of respondents reported that none of their plants are grown for opportunistic demand, while 39.7% (n=27) said 1–20% of their production meets such demand. An additional 8.8% (n=6) reported 21–40%, 2.9% (n=2) reported 41–60%, 5.9% (n=4) reported 61–80%, and 10.3% (n=7) reported over 80% of production is for opportunistic demand. Another 4% (n=3) cited “other” drivers for production.
On average, how many plants do you produce in a year?

Annual production scale spanned from 1-100 plants (n=7, 10%), 100-500 plants (n=11, 15.7%), 500-1,000 (n=7, 10%), 1,000-5,000 (n=10, 14.3%), 5,000-7,500 (n=12, 17.1%), 7,500-10,000 (n=9, 12.9%), more than 10,000 (n=14, 20%). This may represent more than one response per organization.
Assuming increased demand is sufficient, what is your current ability to expand production of containerized plants?

Most containerized plants are produced in either dibble tubes (n=22, 31.4%) or in 4-inch pots (n=21, 30%), although some organizations grow most of their plants in half-gallon (n=10, 14.3%) or 1-gallon pots (n=9, 12.9%). Growing plants out in pots greater than 1 gallon (n=5, 7.14%) or 2-inch pots (n=3, 4.29%) is uncommon. 52.1% reported that they produce seeds for direct seeding, and 47.9% indicated that they do not produce seeds for direct seeding.
Would your organization consider contract growing native plants or seeds for other restoration projects?

Fifty percent of respondents (n=36) reported interest in production contracts, 31.9% (n=23) were maybe interested, and 18.1% (n=13) were not interested.
What are the limitations to expanding production of live plants?

Limitations to expanding production are attributed to labor (n=58, 78.4%), infrastructure (n=45, 60.8%), financing (n=33, 44.6%), seed availability (n=32, 43.2%), land (n=21, 28.4%), seed quality (n=16, 21.6%), regulation (n=11, 14.9%), and the market (n=10, 13.5%).
Do you think that native nurseries will have the capacity to meet reforestation demands in the future?
Yes, No, Maybe so
Key Takeaways
The Current NPM Supply Chain

Respondents largely engaged in multiple roles of the NPM supply chain, largely closed with a lack of specialization.
Pinch points (red asterisk) include concerns of wild populations not being able to sustain the need; collections are largely opportunistic and are constrained by, staff (personnel, time, knowledge), access and availability (come up “empty handed”, short seeded when collections are made), and facilities limitations (processing equipment and storage space).
The production of containerized plants is similarly constrained by staff (skill) as well as by bench space within growing facilities. NPM are used for a wide suit of purposes and they survey largely captured experience of those using NPM for wildlife and plant restoration/rehabilitation. In some instances, these restoration sites become de facto seed production areas. However, seed collection schema greatly impacts the genetic diversity represented in these sites.
Expanded NPM Supply Chain of the Future
Seed production is a mechanism to expand the access to appropriate seed, thus lessening collection pressure on wild population.
Systematic wild collections can increase the diversity (both at the inter- and intra-species level). In congruence with increased production capacity, this has the potential to directly increase NPM supply for a variety of uses.

The efforts of a systematic collection program can increase the availability of common species for use in restoration and are necessary for the development of seed stock. Seed stock can in turn increase seed availability for short-term needs, but ultimately feed into an amplification process through engaging with agricultural production thus developing bulk seed supply critical for landscape level disturbance response
(i.e. direct seeding post-wildfire).
Stock seed development could also be applied at smaller scale, minimizing collection constraints that come with depending on accessing wild populations for NPM. Furthermore, increasing NPM supply serves to open the door for increased opportunities to use NPM.
Acknowledgements
This product serves as the Executive Report for the 2023 Native Plant Material Survey. It can be cited as:
Additionally, survey results will be published in the journal Ecological Restoration. That paper can be cited as:
These efforts would not have been possible without our informal seed working group (plus the OG iteration as the Seed Orchard working group), the folks who gave their time to develop the survey and those of you who contributed your time and experiences by responding to the survey.
Questions, comments, concerns? We want to connect with you! Email EcosystemsExtensionHI @ gmail.com or lportner @ hawaii.edu